Prometheus 데이터 구조
시계열 데이터를 처리하기 위한 기본 데이터 구조는 다음과 같이 정의 됩니다.
type sample struct{Labels map[string]string Value float64}
Metric 이란?
Timestamp와 보통 한두가지 숫자 값을 포함하는 이벤트. 쉽게 수집하는 시계열 데이터로 이해.
프로메테우스의 메트릭 Metric_Name{ field1 = value1, field2=value2} VALUE 로 수집된다.
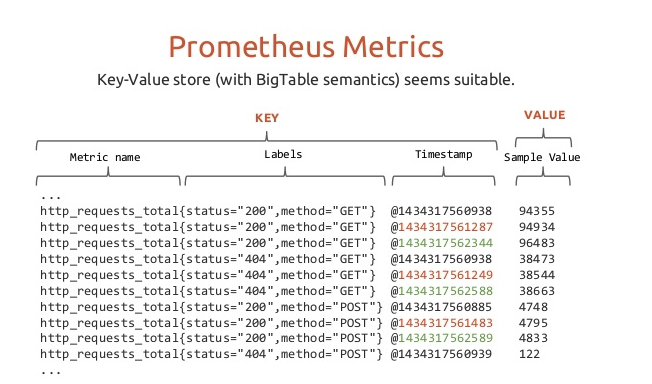
아래는 SpringBoot 2.7.0 에서 actuator와 micrometer-registry-prometheus를 활용하여 띄운 prometheus sample 값(https://github.com/hotpotato0/boot-db-exporter.git)이다.

위 내용처럼 많은 수의 metric이 발생하고 text/html 방식으로 특정 url로 export하면, prometheus 서버에서 이를 긁어가서 데이터를 저장한다.
Metric의 종류
https://prometheus.io/docs/tutorials/understanding_metric_types/#types-of-metrics
Understanding metric types | Prometheus
An open-source monitoring system with a dimensional data model, flexible query language, efficient time series database and modern alerting approach.
prometheus.io
- Counter
증가 또는 재설정만 가능한 메트릭 값이다. 즉 감소는 불가능하다. 요청수, 오류 수 등과 같은 메트릭에 사용할 수 있다.
활용 가능 PromQL : rate - Gauge *주로 사용하는 Metric type
위로 올라가거나 아래로 내려갈 수 있는 숫자. 클러스터의 포드 수, 대기열의 이벤트 수 등과 같은 메트릭에 사용
활용 가능 PromQL : max_over_time, min_over_time, avg_over_time - Histogram
좀더 복잡한 메트릭으로, 버킷 값을 기준으로 계산되는 모든 계산 값에 사용할 수 있다. 버킷 경계는 개발자가 구성 가능.
일반적인 예로는 요청에 응답하는데 걸리는 시간(지연) - Summary
이것도 이벤트를 측정하고, 히스토그램의 대안. 버킷을 미리 알수 없을때 사용되지만, Summary 보단 Histogram 사용을 권장